- Written by johnkremer
- On Dec 15 2012,
- In Internet Marketing
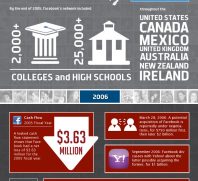
A Look Back: Facebook vs. Google
This infographic looks at the differences and similarities between Google and Facebook in September 2010.
In August 2010, Americans spent 41.1 million minutes on Facebook versus 39.8 million minutes spent on Google.
Google’s 2004 IPO opened at $1.7 billion in company value while Facebook’s 2011 IPO opened near $35 billion in company value.
In 2010, Google had almost 20,000 employees and $23.7 billion in revenue while Facebook had 1,700 employees with $1.5 billion in revenue.
====================================
Charity Showcase
Rainforest Alliance helps to protect the forests, wildlife, and people of the rain forests. Also works to provide education and healthcare to children of the rain forests. To learn more about small actions that can lead to big changes, go to http://www.rainforest-alliance.org/smallactions.
Related
by johnkremer
Search This Site
Does This Interest You?
RadioPRGuy.com
“When you decide that you’re ready to start dealing with radio stations directly, get Alex Carroll’s program. His top radio show database, tapes of dealing with producers, and examples of actual talk shows will help you to become a radio talk show star.” — John Kremer
CLICK HERE FOR FREE DETAILS
Internet Marketing Infographics
-
20 Reasons to Switch to Google Plus
Sep, 18, 2012
-
Infographic: Keep Your Online Information Sa...
Sep, 25, 2012
-
10 Essential Social Media Tips for a Senior ...
Sep, 26, 2012
-
Infographic: The History of Facebook
Feb, 22, 2013
-
Social Media Infographics Index
Jan, 13, 2013
-
Motivational Bookmark: Happiness Depends on ...
Jan, 14, 2013
-
Infographic: Five Simple Tips to Use LinkedI...
Oct, 28, 2012
-
Infographic: Mobile Users Have Not Abandoned...
Dec, 19, 2012
-
How to Create an Infographic in 7 Steps
Sep, 19, 2012
-
12 Things to Do After You’ve Written a...
Sep, 19, 2012